Dies ist eine alte Version des Dokuments!
Inhaltsverzeichnis
GuiPy
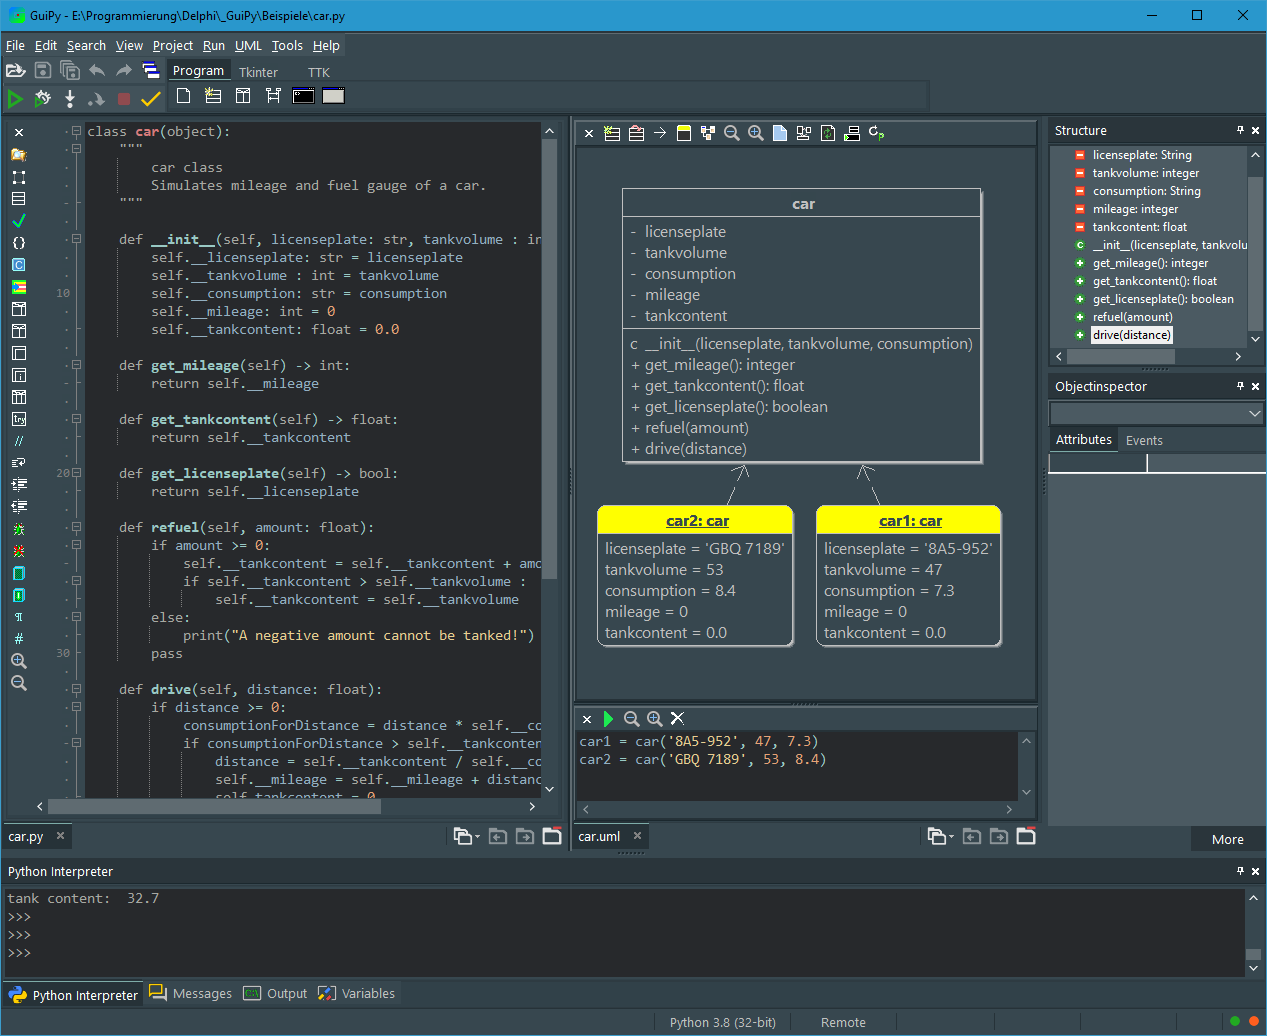
GuiPy is a Python IDE for teachers and students. Most Python IDEs only support text-based coding, GuiPy instead has several graphical tools to aid in learning and teaching Python programming concepts. GuiPy has these graphical tools:
- GUI designer for Tkinter and TTK
- Class modeler for modelling classes with attributes and methods
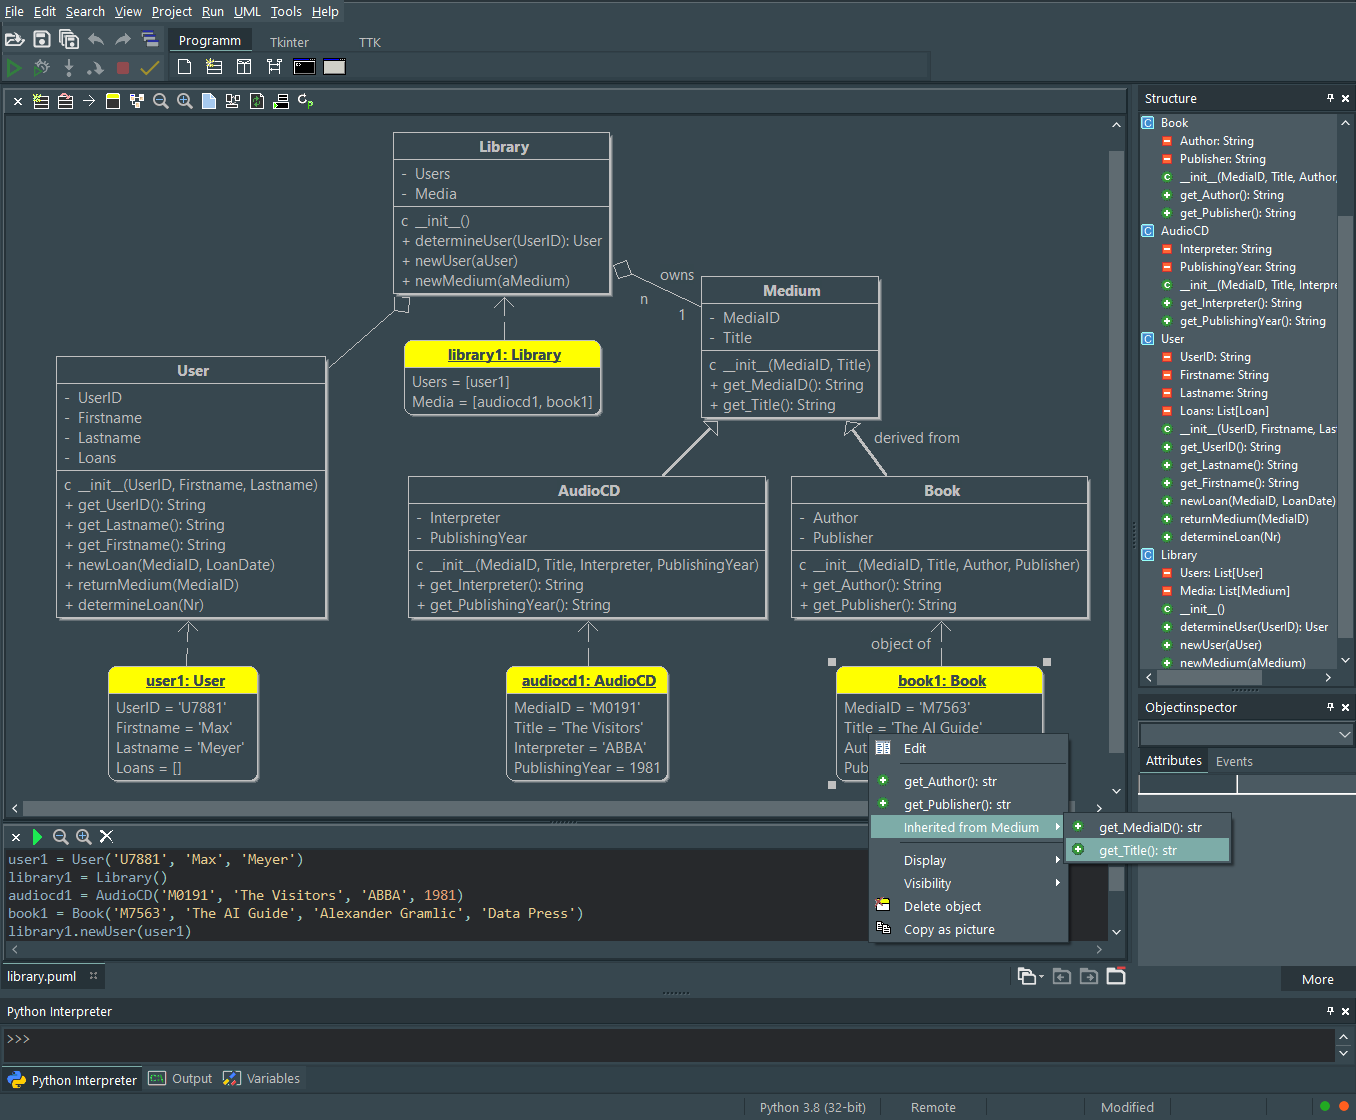
- UML window with classes and their connections. You can create objects by calling the constructor. Methods of objects can be called interactively.
- Structogram editor for creating strutograms and converting them into Python code.
- Sequence diagram editor for modelling sequence diagrams with lifelines an activations.
Class Modeler
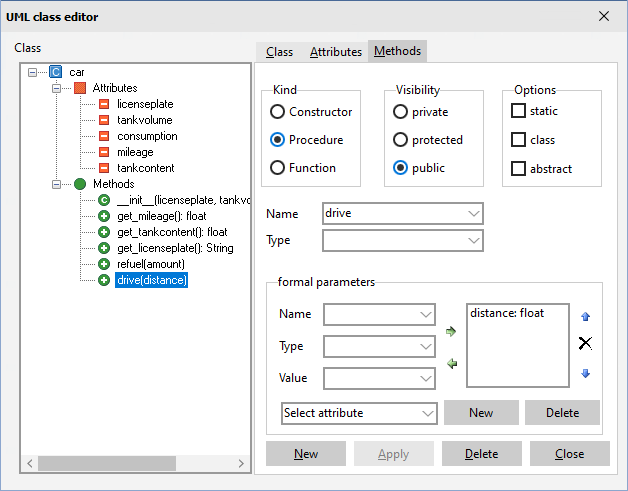
With class modeler you can create new classes and edit existing classes. It reads python source files and displays them as classes with attributes and methods. Changes in the class modeler are transferred accordingly to the python source files. The class modeler is an easy to use tool for modelling classes.
The order of attributes and methods in the structure tree can be changed by drag&drop.
Call the class modeler using the icon  in the editor window. You can also double-click the required class in the UML window or use the context menu to call up the class modeler.
UML Window
After you've modeled a class with the class modeler, it's time to test your model. In the uml window, you can right-click to open a class's context menu to invoke the constructor to create an object interactively.
If you then invoke the context menu of the created object, you can edit the attributes and invoke the methods of the object. Changed attribute values are easy to see, and objects created by a method call are immediately visible. This is particularly useful when working with dynamic data structures such as lists and trees.
GUI Designer
After testing your model in the uml window you can use it in a console or GUI program.
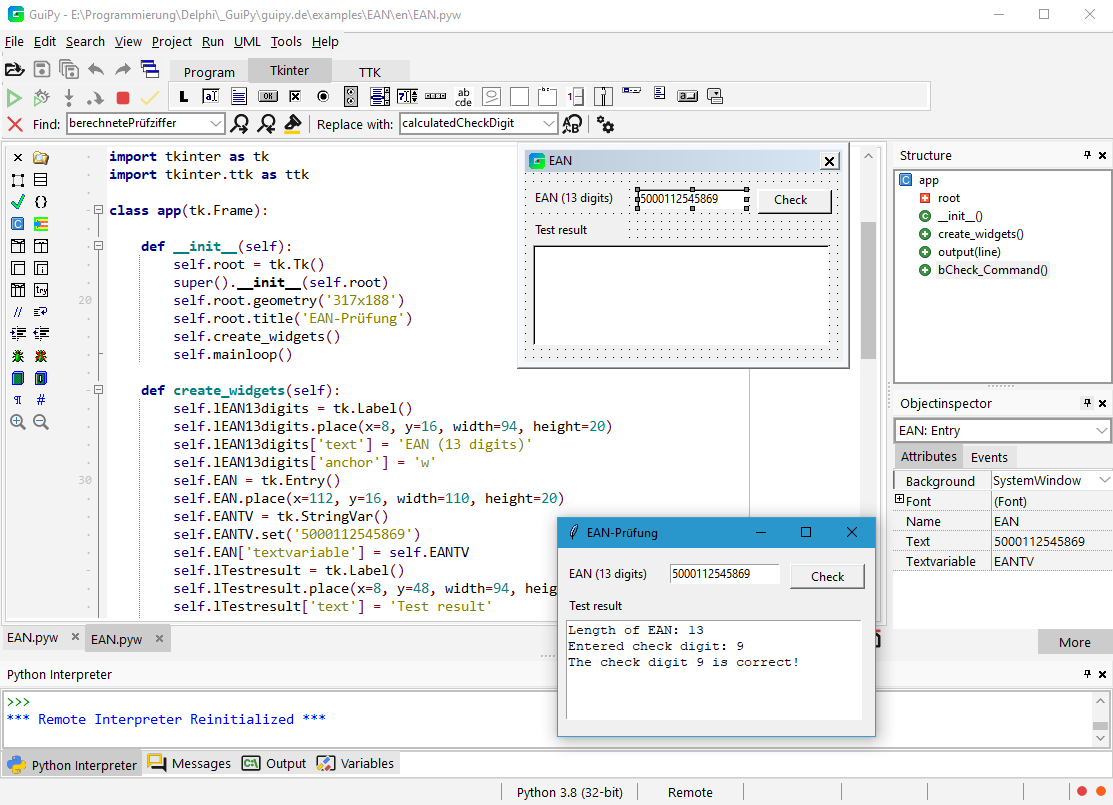
It's quite difficult to design graphical user interfaces when using layout managers. Students really don't like this because it's much easier to drag and drop GUI components to the desired position on a form. So, GuiPy's GUI designer uses absolute positioning, which allows you to design your layout pretty quickly.
To create a GUI program, click the  icon on the „Program“ tab. This provides a skeleton program in an editor window and a GUI form.
To place a GUI component, first click its icon on the Tkinter or TTK tab and then click in the GUI form. Alternatively, you can drag and drop a GUI component from a tab onto your GUI form. You can then position the GUI component and configure it using the Object Inspector. The source code is synchronized accordingly.
With the symbol  of a source code editor you open the corresponding GUI form.
The GUI form has a context menu for editing the components.
Struktogram editor
GuiPy has a structogram editor that can be used to create and edit structograms.
The modeling of processes with structograms on a programming language-independent level plays an important role in computer science lessons because algorithms can be modeled on an abstract level without specific programming language details. An algorithm can be understood without being able to program it yourself in Python. Manually drawing structure diagrams on paper does not bring any good results, because structural changes are practically impossible. With the structure diagram editor, structure diagrams can be created easily, quickly and correctly. Python source code can be generated from structograms, but this must then be edited. This helps when implementing in Python.
The reverse way also works. In the editor you can select source text and use it to create a structured diagram.
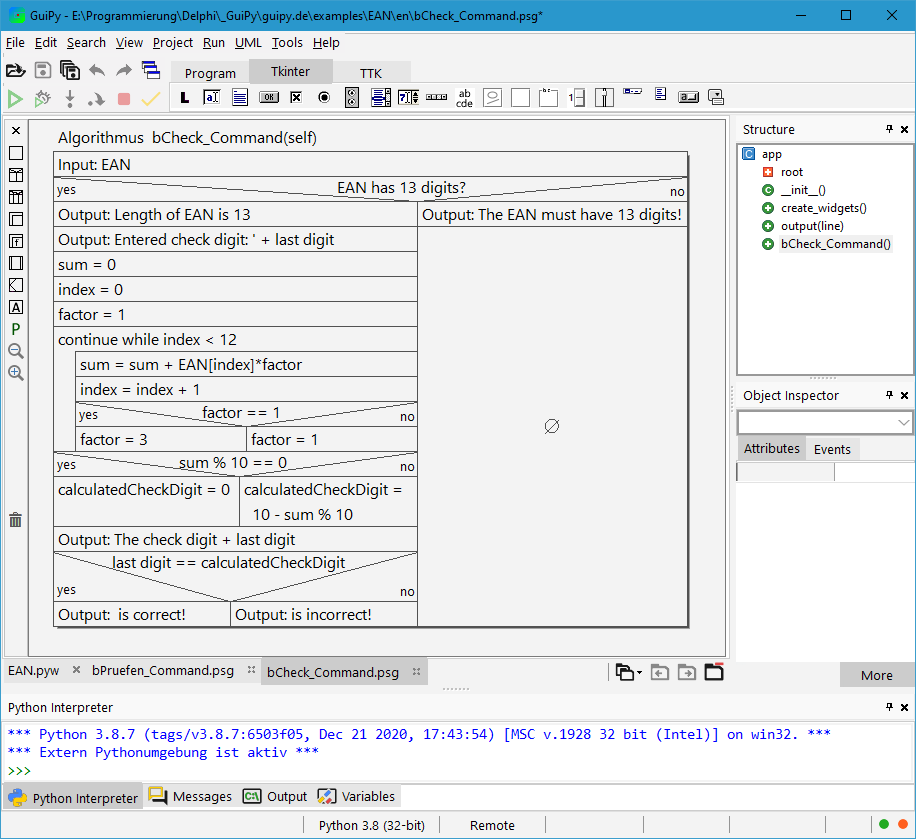 Structural chart elements can be inserted into and extracted from a structogram using Drag&Drop. If you pull down a structogram element, all subsequent elements are also separated. Structogram elements can be dragged out of the left toolbar and dragged back onto the toolbar to delete them. You click on empty structure chart elements and simply type in the text. For subsequent editing, double-click the relevant text.
The green P generates a Python function from the structure chart as far as possible. The texts used in the structure chart can be adjusted in the configuration.

